


Amid the hue and cry over the NITI Aayog’s report of Meghalaya being the third poorest State in India, data in the report showed West Khasi Hills as the poorest district in the State. The report also indicated that all districts in Garo Hills have less number of people suffering from poverty.
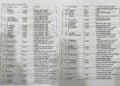
NITI Aayog’s report ‘National Multidimensional Poverty Index: A Progress Review 2023’ released on July 17 gave the percentage of population who are multidimensionally poor in each district of the State.
The report said that West Khasi Hills has shown an increase in the number of poor people based on two National Family Health Surveys (NFHS).
As per NFHS-5 (2019-21) as many as 52.48 per cent are multidimensionally poor in West Khasi Hills as compared to 39.59 per cent in NFHS-4 (2015-16).
West Jaintia Hills came second in the percentage of poor people with 52.08 per cent. It was followed by East Jaintia Hills at 43.79 per cent as per NFHS-5. However, the percentage of poor in East Jaintia Hills has come down from 46.07 per cent recorded in NFHS-4.
The percentage of poor people in South West Khasi Hills is 40.98 per cent. In Ri-Bhoi, it was 31.67 per cent, although it came down drastically from 46.31 per cent as recorded in NFHS-4.
In East Khasi Hills, the multidimensionally poor account for 24.10 per cent (NFHS-5). This showed an increase of poor people in the district. In the NFHS-4, the percentage was only 23.39 per cent.
Interestingly, all districts in Garo Hills are far better as the number of multidimensionally poor is concerned.
In South West Garo Hills, it was only 18.27 per cent. In East Garo Hills it was 14.96 per cent which showed an increase from 41.78 per cent as recorded in NFHS-4. In North Garo Hills, the percentage of multidimensionally poor is 13.26 per cent.
South Garo Hills has reduced the number of poor people to 9.77 per cent (NFHS-5) from 11.27 per cent (NFHS-4).
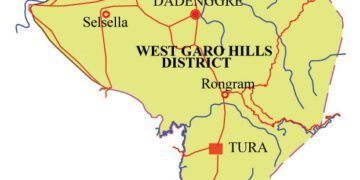
Further, in what may be seen as a steep reduction in the number of multidimensionally poor people, West Garo Hills currently has only 8 per cent of such people as compared to 27.29 per cent as recorded in NFHS-4.
This second edition of the National Multidimensional Poverty Index (MPI) represents India’s progress in reducing multidimensional poverty between the two surveys, NFHS-4 (2015-16) and NFHS-5 (2019-21). It builds on the Baseline Report of India’s National MPI launched in November 2021. The broad methodology followed is in consonance with the global methodology.
The National MPI measures simultaneous deprivations across the three equally weighted dimensions of health, education, and standard of living that are represented by 12 SDG-aligned indicators. These include nutrition, child and adolescent mortality, maternal health, years of schooling, school attendance, cooking fuel, sanitation, drinking water, electricity, housing, assets, and bank accounts.